AI Adoption Dashboard
The AI Adoption Dashboard helps engineering leaders understand how deeply and consistently their teams are using AI across development workflows. It provides a single AI Adoption Score (0–100) that quantifies organizational AI maturity, plus detailed breakdowns by dimension.
Who Is It For?
This dashboard is designed for team leads, engineering managers, and executives who want to:
- Track AI integration progress across their organization
- Compare teams using a single benchmark number
- Identify low-, medium-, and high-adoption teams
- Quote a simple metric to stakeholders ("We're at 63; we want to be at 80")
Accessing the Dashboard
- Navigate to app.kilo.ai and sign in
- Select your organization
- Click the Usage tab in the dashboard navigation
- The AI Adoption Score card appears at the top of the usage view
Dashboard Overview
Main Score Display
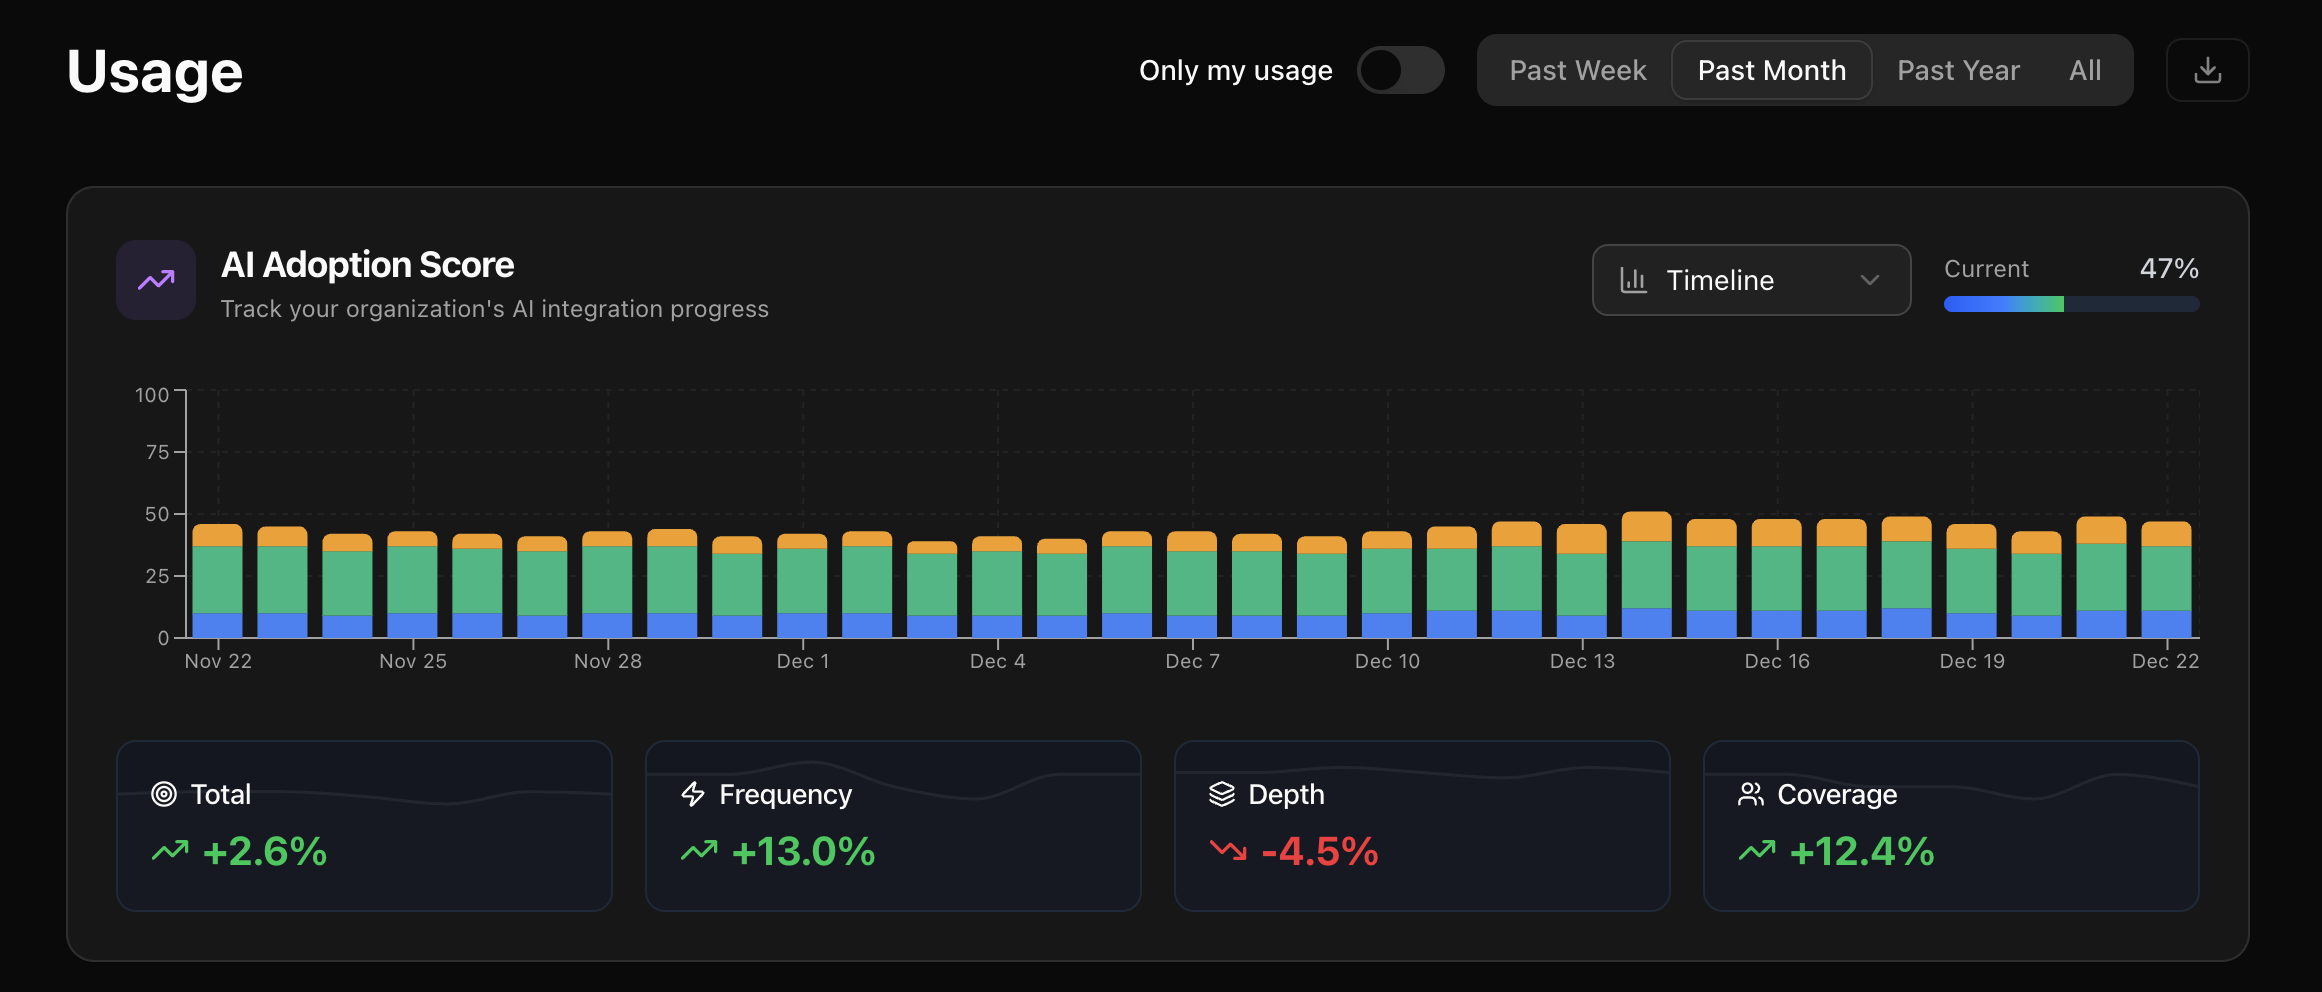
The dashboard prominently displays your current AI Adoption Score as a percentage (e.g., "Current: 45%"). This score represents how deeply and consistently your organization uses AI across real development workflows.
Timeline Visualization
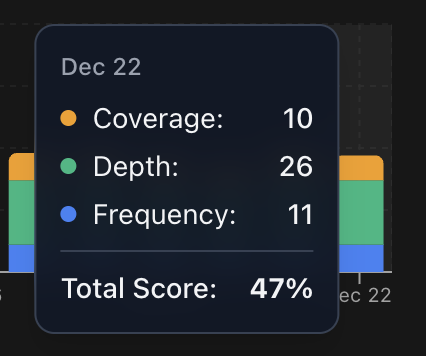
A stacked bar chart shows your daily adoption scores over time. The chart uses three colors representing the score's dimensions:
- Blue — Frequency (how often developers use AI)
- Green — Depth (how integrated AI is into development)
- Orange — Coverage (how broadly AI is adopted across the team)
Time Period Filters
Filter the data by selecting:
- Past Week — Last 7 days
- Past Month — Last 30 days
- Past Year — Last 365 days
- All — Complete history
Personal vs. Organization View
Use the "Only my usage" toggle to switch between:
- Enabled — Your individual adoption metrics
- Disabled — Organization-wide adoption metrics
Trend Indicators
Four metric cards at the bottom of the dashboard show week-over-week changes:
- Total — Overall score trend
- Frequency — Changes in usage frequency
- Depth — Changes in integration depth
- Coverage — Changes in team-wide adoption
Each card displays the percentage change (e.g., "+2.3%" or "-1.5%") with a directional indicator.
The Three Dimensions
The AI Adoption Score is composed of three weighted dimensions:
| Dimension | Weight | Question It Answers |
|---|---|---|
| Frequency | 40% | How often do developers use AI? |
| Depth | 40% | How integrated is AI into actual development? |
| Coverage | 20% | How broadly is AI being adopted across the team? |
Click on any dimension card to view detailed analysis and improvement suggestions specific to that dimension.
Quick Reference: Score Tiers
| Score Range | Tier | Description |
|---|---|---|
| 0–20 | Minimal adoption | AI usage is sporadic or experimental |
| 21–50 | Early adoption | Some developers are using AI regularly |
| 51–75 | Growing adoption | AI is becoming part of team workflows |
| 76–90 | Strong adoption | AI is deeply integrated into development |
| 91–100 | AI-first engineering org | AI is central to how the team ships code |