Understanding Your AI Adoption Score
The AI Adoption Score is a 0–100 metric representing how deeply and consistently your team uses AI across real development workflows. This page explains what each dimension measures and how to interpret your score.
The Three Dimensions
Your total score is calculated from three weighted dimensions:
Frequency (40% of total score)
"How often do developers use AI?"
This dimension measures the regularity of AI tool usage across your team, normalized per-user and blended across the organization.
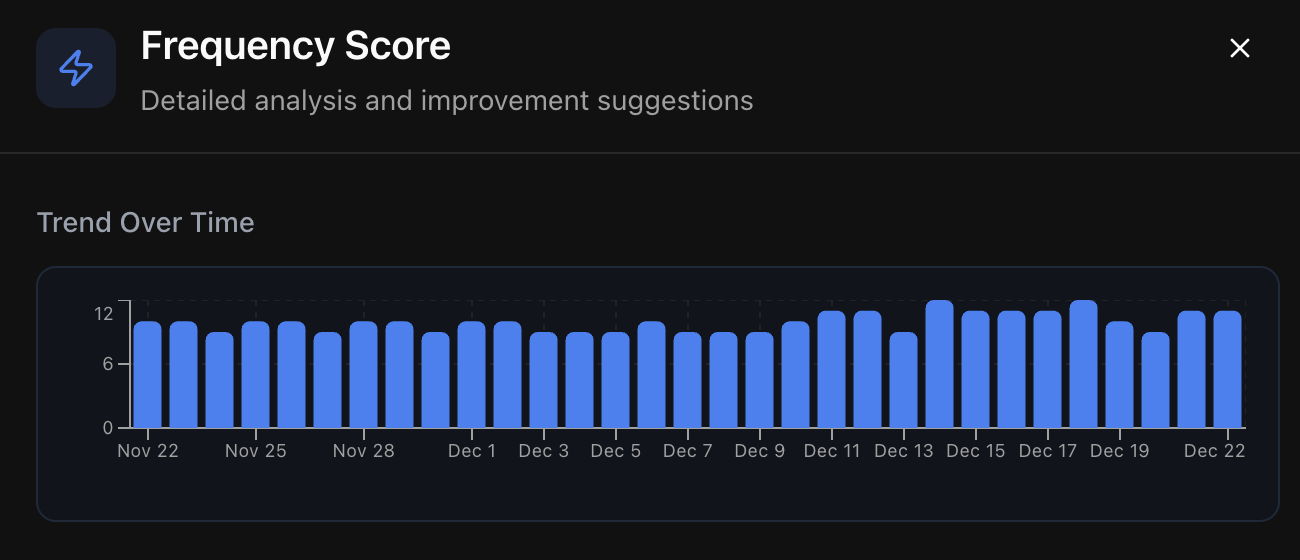
Signals measured:
- Agent interactions per day
- Autocomplete acceptance
- Cloud Agent sessions
- Reviewer Agent runs
What it tells you: Teams with high Frequency scores have made AI a daily habit—not something they reach for only on difficult problems. Low Frequency often indicates that developers haven't yet built AI into their regular workflow.
Depth (40% of total score)
"How integrated is AI into actual development?"
This dimension captures trust and dependency—whether AI is a side tool or an integral part of how your team ships code.
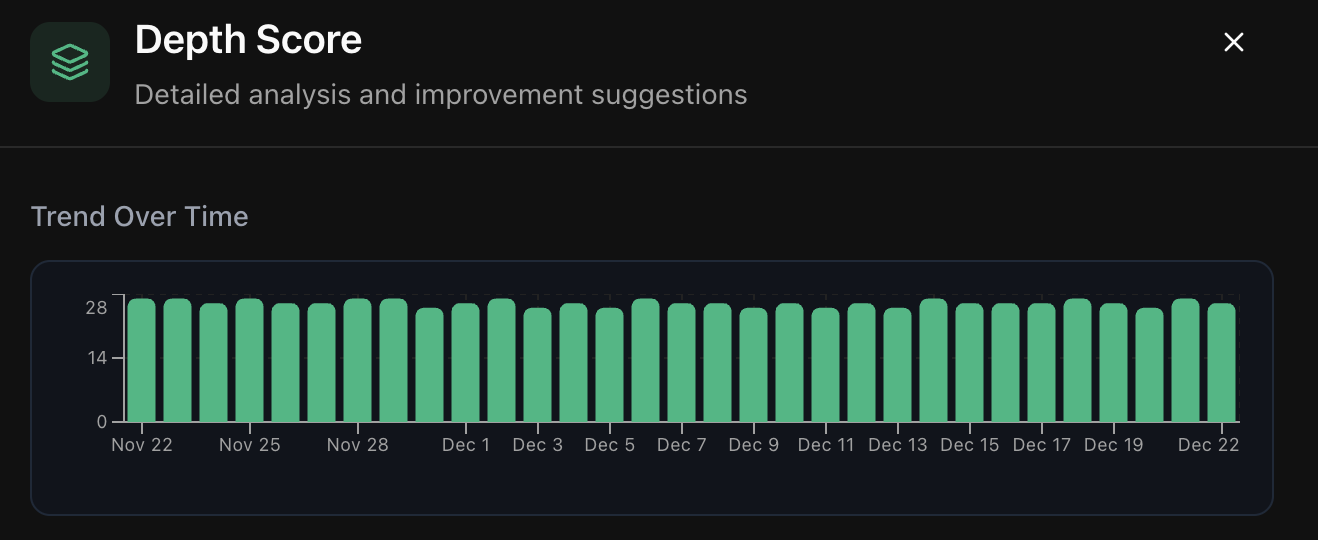
Signals measured:
- Queries per hour worked
- Percentage of AI suggestions accepted
- AI-generated lines merged into the codebase
- Retention rate: Percentage of AI-suggested lines merged unaltered
- Multi-agent chains (coding → review → deploy)
What it tells you: High Depth scores indicate that developers trust AI output enough to ship it. Low Depth may mean developers are experimenting with AI but not adopting its suggestions, which could signal context or quality issues.
Coverage (20% of total score)
"How broadly is AI being adopted across the team?"
This dimension captures reach and rollout—how many team members are using AI and how consistently throughout the week.
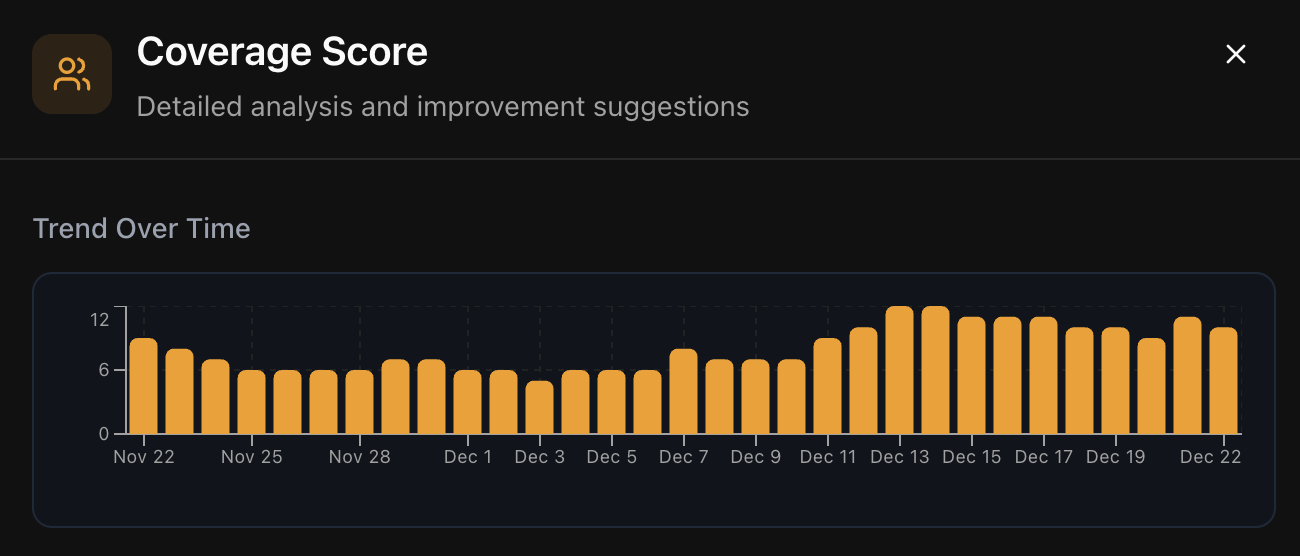
Signals measured:
- Percentage of users using any AI agent weekly
- Percentage of users adopting 2+ agents
- Percentage adopting 4+ agents
- Weekday usage breadth (usage throughout the week vs. concentrated on specific days)
What it tells you: Coverage reveals adoption gaps. A team might have power users driving high Frequency and Depth scores while other team members barely use AI at all.
Score Tiers
Your score falls into one of five tiers:
| Score Range | Tier | What It Means |
|---|---|---|
| 0–20 | Minimal adoption | AI usage is sporadic or experimental. Most developers aren't using AI tools regularly. |
| 21–50 | Early adoption | Some developers have incorporated AI into their workflow, but it's not yet team-wide. |
| 51–75 | Growing adoption | AI is becoming a standard part of how the team works. Most developers use it, though depth varies. |
| 76–90 | Strong adoption | AI is deeply integrated into development workflows. Teams at this level trust and depend on AI suggestions. |
| 91–100 | AI-first engineering org | AI is central to how the team ships code. Usage is high, broad, and deeply integrated. |
How Scores Are Calculated
The scoring system applies several normalization techniques to produce meaningful, comparable scores:
Per-Developer Normalization
Usage is normalized on a per-developer basis. This means a 10-person team using AI moderately will score comparably to a 50-person team using AI moderately—raw volume doesn't inflate scores.
Outlier Capping
Extreme usage by individual power users is capped to prevent a single enthusiastic developer from skewing the entire team's score.
Rolling Window
Scores use a weekly rolling window for stability. This smooths out day-to-day fluctuations while still responding to real changes in behavior.
Multi-Source Aggregation
The score aggregates event streams from multiple surfaces:
- IDE — Autocomplete and coding agent interactions
- CLI — Terminal-based AI usage
- Reviewer Agent — AI-assisted code reviews
- Cloud Agent — Browser-based AI sessions
Why Scores Fluctuate
Your score may change from week to week for several reasons:
Normal fluctuations:
- Team members on vacation or leave
- End-of-sprint vs. start-of-sprint patterns
- Seasonal variations (holidays, summer slowdowns)
Meaningful changes:
- New team members onboarding (may temporarily lower Coverage)
- Team members leaving the organization
- Changes in development workflow or tooling
- Successful adoption initiatives
Interpreting Your Score
Focus on Trends, Not Absolutes
The exact number matters less than the direction. A score of 45 means "early adoption, room to grow"—but whether that's good or bad depends on where you were last month and where you're headed.
Compare Dimensions
If your total score is low, look at which dimension is pulling it down:
- Low Frequency? Focus on building daily habits
- Low Depth? Work on trust and context quality
- Low Coverage? Focus on onboarding and activation
Distribution Over Average
While the dashboard shows aggregate scores, the real insight often comes from understanding distribution. A team with a 50 score might have half the team at 80+ and half at 20—that's different from everyone at 50.
What About Individual Scores?
Individual user scores are available through the "Only my usage" toggle. However, the real value of the AI Adoption Score is in:
- Aggregate team metrics — Understanding organizational trends
- Distribution analysis — Identifying adoption gaps
- Comparative benchmarking — Setting and tracking goals
Individual scores are most useful for personal development and self-assessment, not performance evaluation.