Earth visualizer
Prompt: "Create an animation of the earth spinning in space"
Auto Efficient
Cost: $0.01
Claude Opus 4.8
Cost: $0.37
Auto Efficient achieves 69% of Opus completion at 77% lower cost — measured on Terminal Bench 2.0 using the Kilo agent harness.
The three stats that matter most when evaluating cost vs performance on Terminal Bench 2.0.
77% cheaper
Auto Efficient vs Claude Opus 4.8
$19.60 vs $85.19
Auto Efficient vs Claude Opus 4.8
46.7% vs 67.6%
Terminal Bench 2.0
Four one-shot app prompts, compared across Auto Efficient and Claude Opus 4.8.
Prompt: "Create an animation of the earth spinning in space"
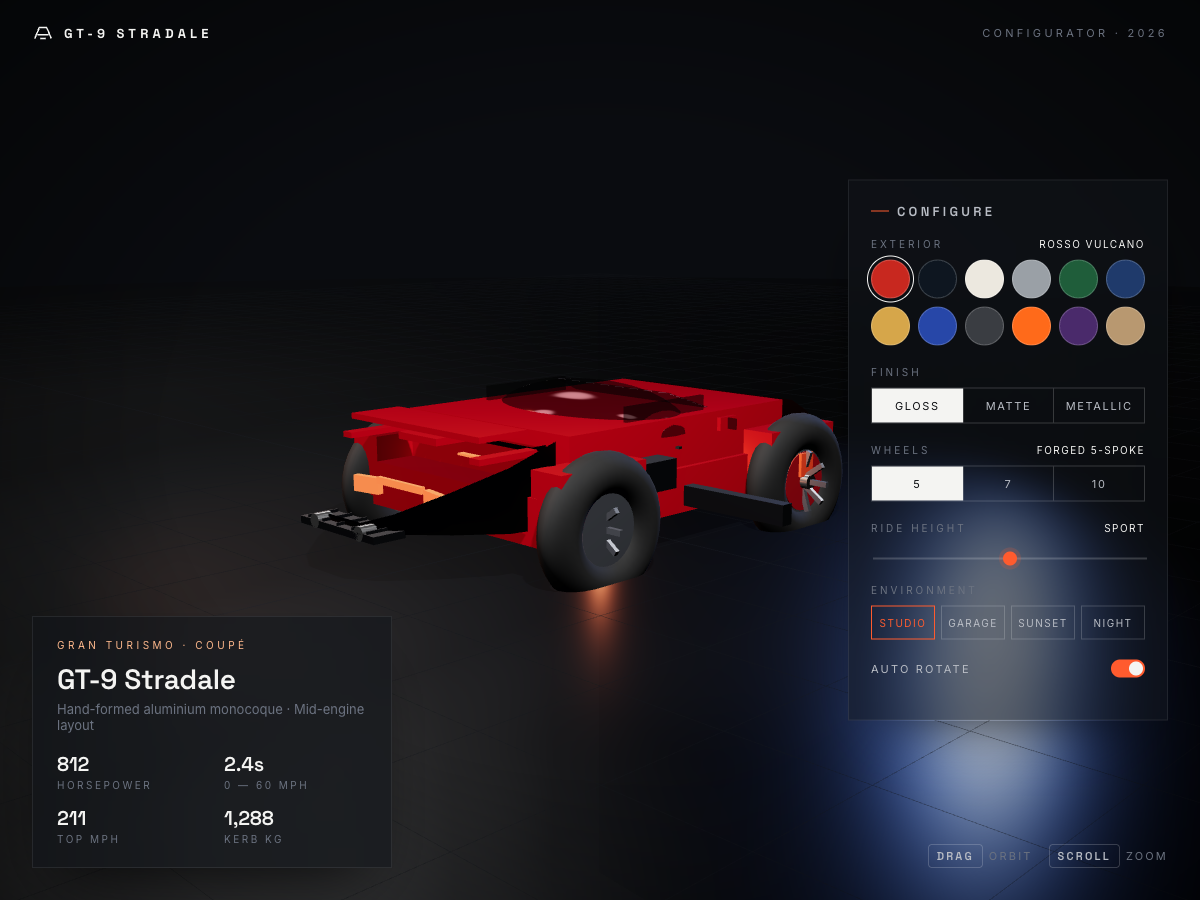
Prompt: "Create a 3D visualizer of a sportscar"

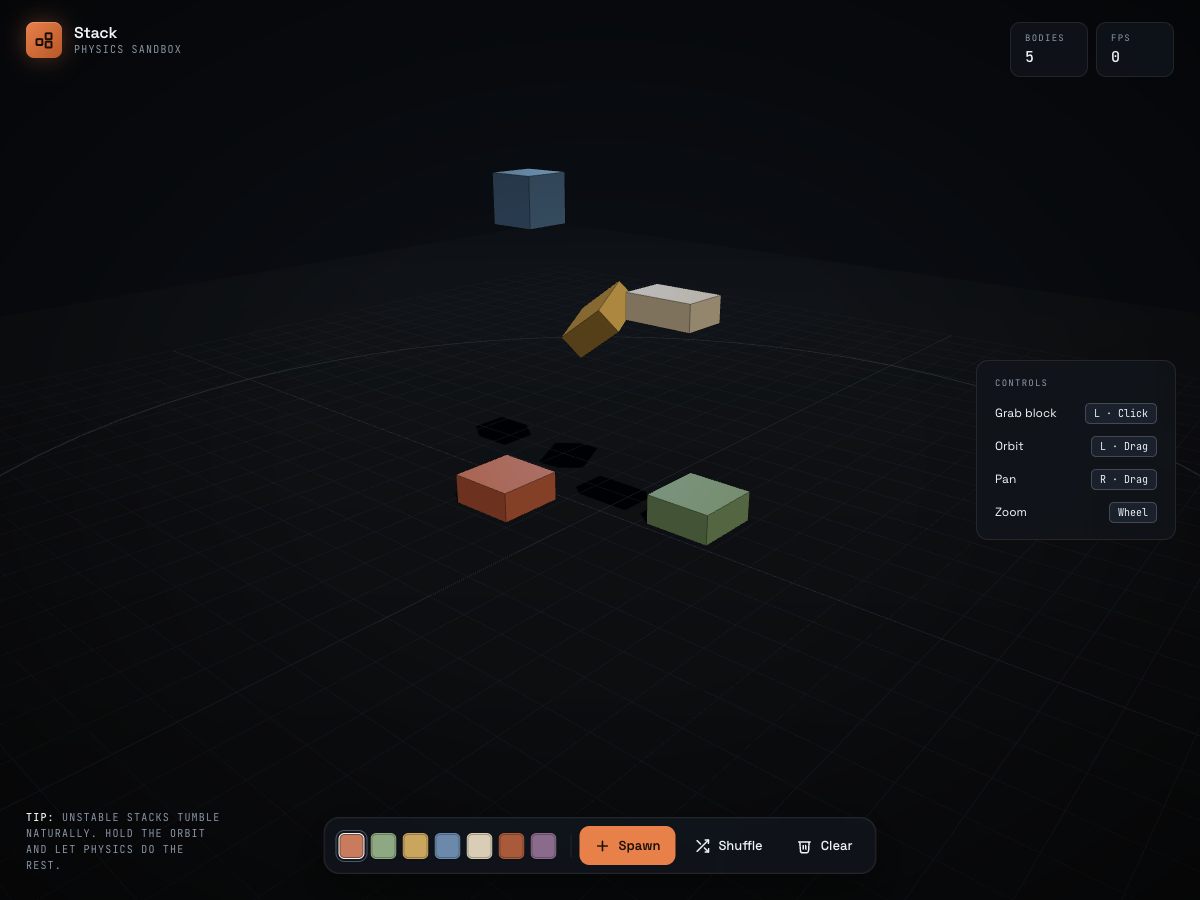
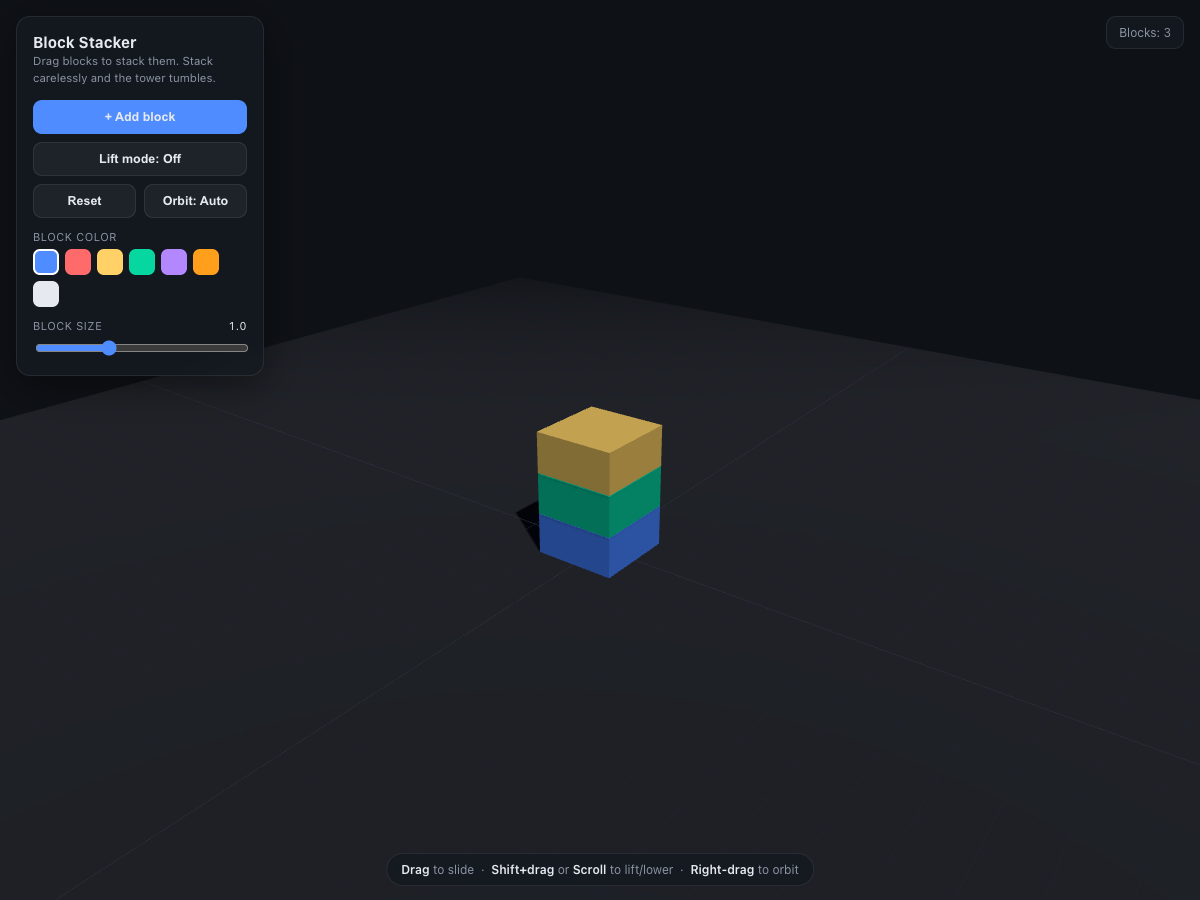
Prompt: "Create a physics simulator that allows you to drag and stack 3D blocks onto one another, and they tumble if they aren't balanced."
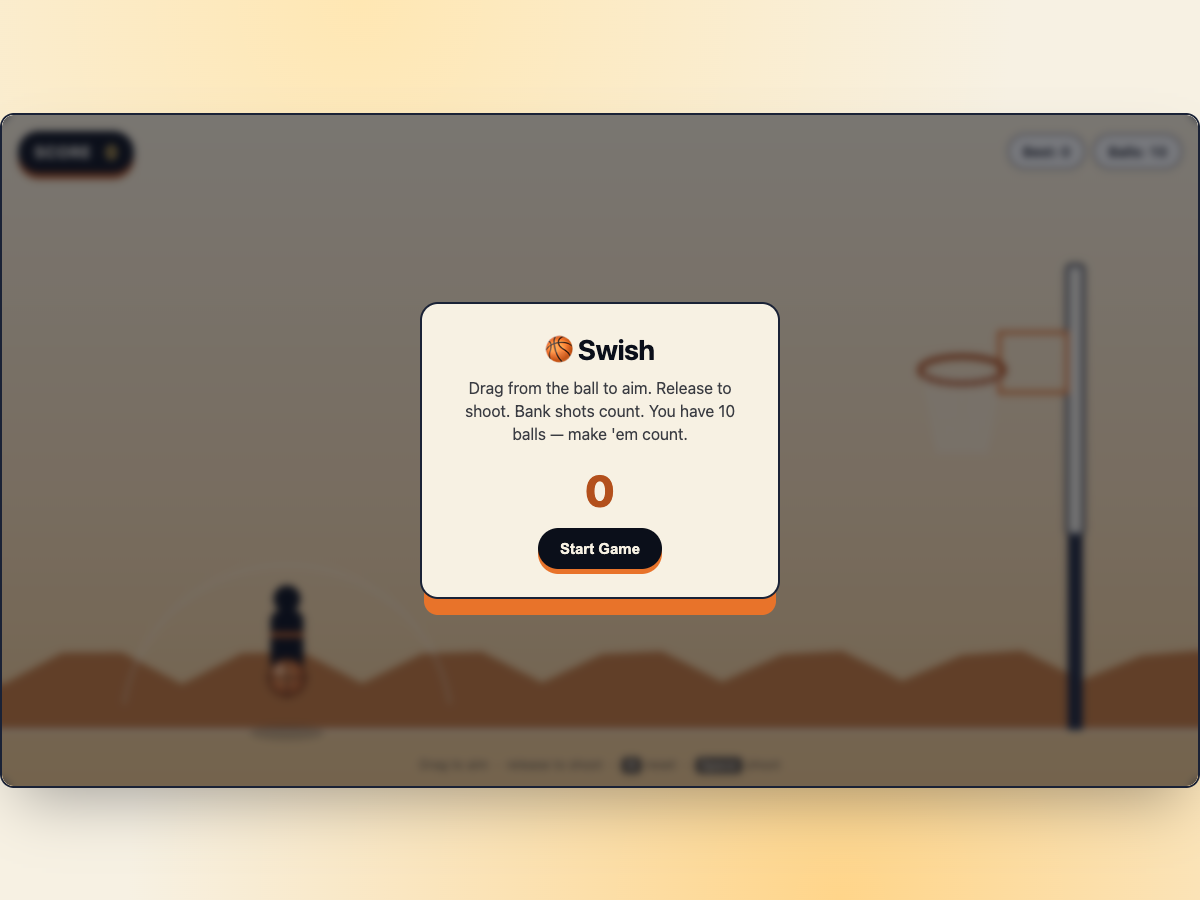
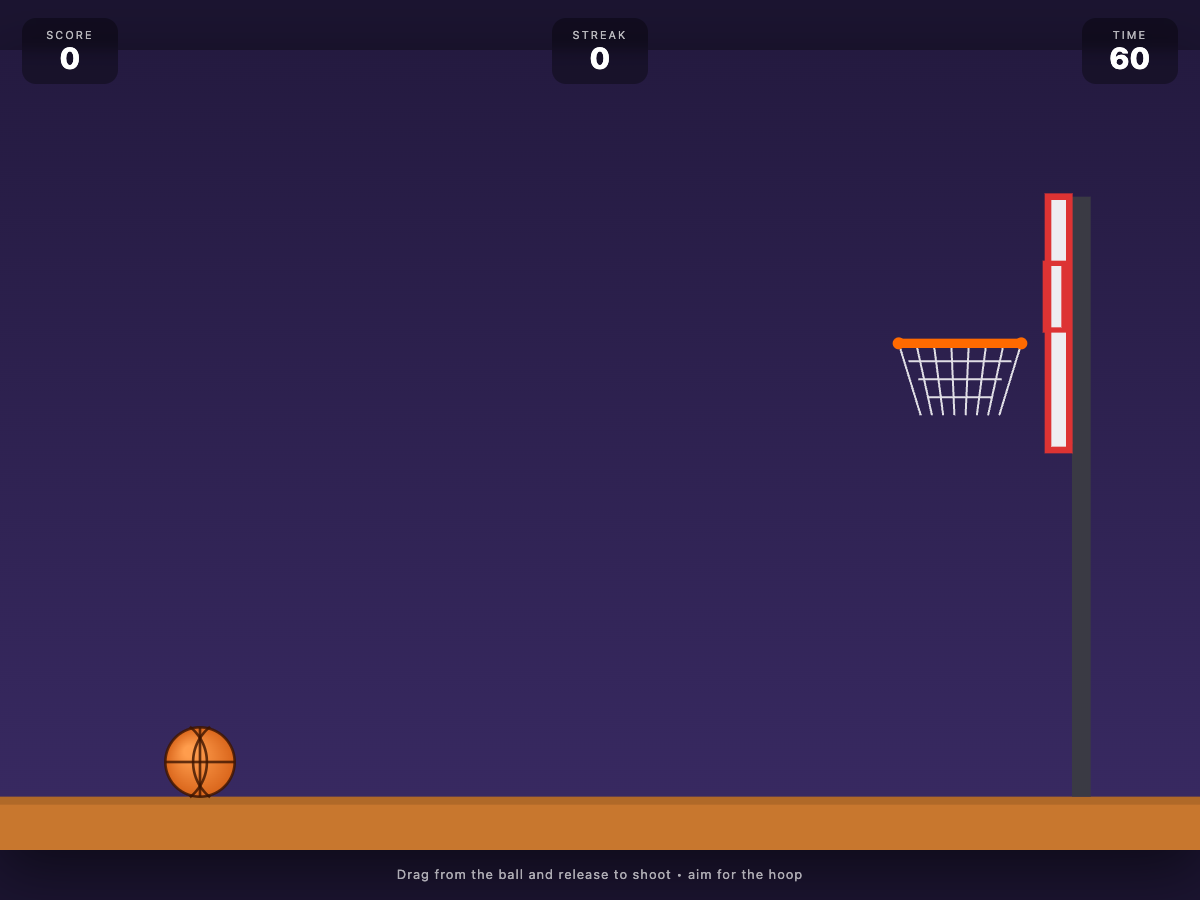
Prompt: "Create a game that lets you shoot basketballs into a hoop"
All Terminal Bench 2.0 benchmark metrics side by side. 5 attempts per model, 445 tasks total.
Bottom line: Auto Efficient solves 208 of 445 tasks (46.7%) at $0.22 per task. Opus solves 301 (67.6%) at $0.97 per task. For workloads where 69% of Opus performance is sufficient, Auto Efficient costs 77% less per attempt.
Methodology
Every number comes from running both models through the same Kilo agent harness, not a generic scaffold. Costs include reasoning tokens, accumulated context re-sends, and all agent loop overhead.
Higher is better. It measures the fraction of benchmark tasks the model completed end-to-end through Kilo's harness — not a synthetic scaffold.
Sticker per-token pricing tells you almost nothing. These costs include reasoning tokens, cumulative context re-sends, and all agent loop overhead from the actual Kilo pipeline.
Cost per attempt divided by completion rate. A model that is cheap but rarely completes tasks can cost more per solved task than one with a higher attempt price.
Each model is run 5 times across all 89 Terminal Bench 2.0 tasks. The 445-task total gives a statistically reliable signal rather than a single noisy pass.
The case for cost-efficient model routing when frontier spend is not always justified.
At $19.60 vs $85.19 per attempt on Terminal Bench 2.0, Auto Efficient frees up budget for the tasks that actually need frontier-level models.
Auto Efficient uses live session classification to route each request to the model that fits the work — not just the most expensive one available.
For exploratory work, refactoring, documentation, and straightforward coding tasks, 46.7% completion at $0.22/task is often the right tradeoff.
Auto Efficient is not a single frozen model — it routes to benchmark-proven models that match the session type, so quality tracks the work rather than the price tag.
Auto Efficient
Let Kilo's Auto Efficient tier route your tasks intelligently. Session-aware routing picks the right model for the work — so you spend less without manually managing model selection.
Explore all four Auto Model tiers — Efficient, Frontier, Balanced, and Free — and how Kilo's session-aware routing works.
Learn moreBrowse officially promoted KiloBench scores: completion rates, cost per attempt, and performance data for AI coding models on Terminal Bench 2.0.
Learn moreSee which models developers actually reach for across coding, planning, debugging, and agent workflows in real time.
Learn moreAdd extra free inference every month so Auto Efficient has more room to route across the right models for each session.
Learn more